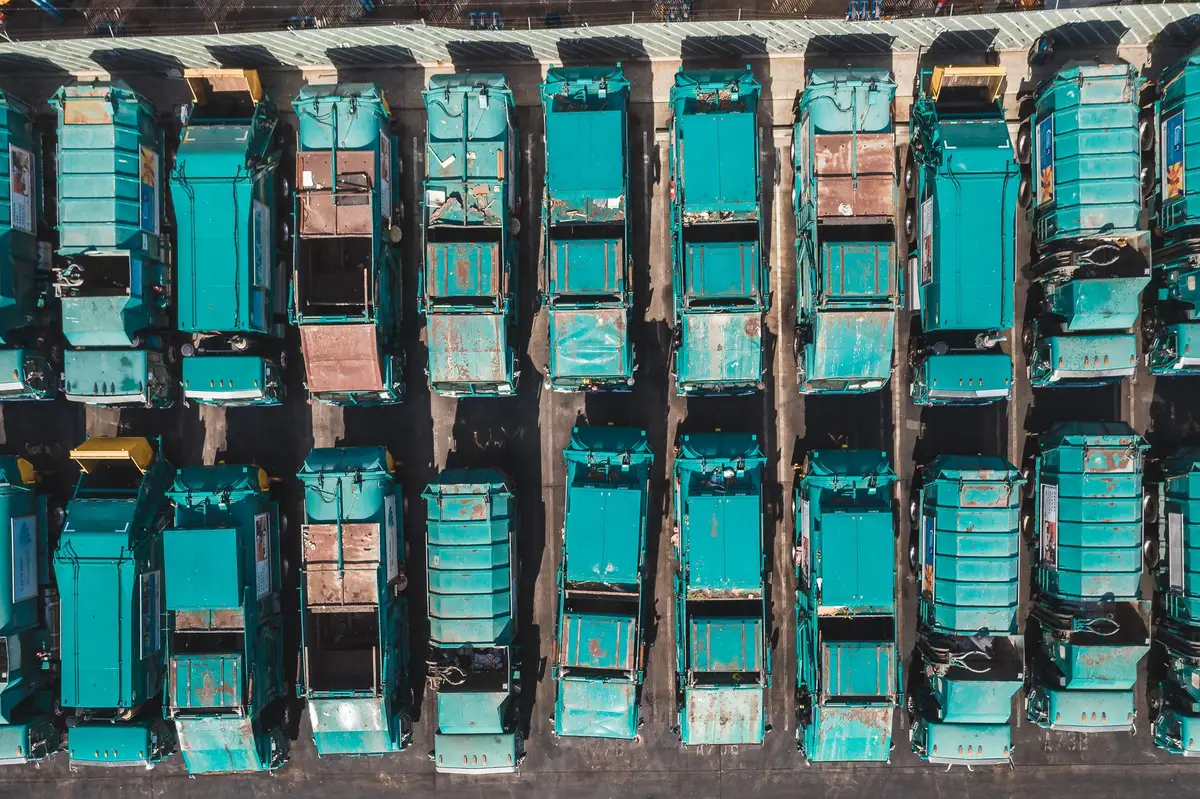
Waste runs on density. We show the cost of the gaps.
Waste-haulage profit is route density, bins or skips per shift against fuel, labour and tip fees. Fleetric reads the mandated feed, allocates cost per lift and per route, and ranks the routes that earn versus the ones that quietly run at a loss.
The P&L levers
Where the money leaks - and where we catch it.
Dominant cost lever
- Lifts per shiftAED/lift
- Tip / landfill dwell−18 min/trip
Lever 01
Lifts per shift
Low-density routes spread cost over too few lifts. We compute cost-per-lift to re-sequence the round.
AED/lift
Lever 02
Tip / landfill dwell
Queueing at the transfer station is paid time off the route. We measure dwell and tie it to throughput.
−18 min/trip
In the product
The profit ranking, per truck.
One screen ranks your fleet from most profitable to most loss-making, with the lever behind every red line.
See how it worksProfit per truck — ranking
- #07 +AED 4,910
- #14 +AED 3,866
- #22 +AED 1,205
- #09 −AED 480
- #31 −AED 1,240
FAQ
Waste haulage
Can Fleetric allocate tip fees to the right route?
Yes. Import tip-fee and weighbridge records as CSV and Fleetric attributes them to the route, vehicle and customer alongside fuel and labour for a true cost-per-lift.
See the profit of your waste haulage fleet.
Fleetric runs in daily production with a construction fleet in Abu Dhabi. Book a demo to see it on your own fleet’s numbers.
Start freeTHE COMPLETE FLEET PLATFORM. BUILT FOR THE GULF.